Whitepaper · Vulnerability research and technical analysis
Continuous Threat Exposure Management: a critical review and an evidence-led operating model
What CTEM adds to vulnerability management, which of its assumptions public exploitation data supports, and how to run it so that reduced exposure can be shown, audited and mapped to NIST CSF 2.0, CIS Controls and MAS TRM.
Research cut-off: 12 November 2026 · Proposed implementation framework; not empirically validated.
1Executive summary
Exploitation of software vulnerabilities is now the most common way into an organisation. Verizon’s 2026 Data Breach Investigations Report attributes 31% of breaches to it, ahead of stolen credentials [1], and Mandiant found exploits to be the leading initial infection vector for the sixth consecutive year, at 32% of intrusions [2]. Yet most vulnerability programmes still manage a backlog of scanner findings ranked by severity, a method that measures activity better than it measures risk.
Continuous Threat Exposure Management (CTEM), introduced by Gartner in 2022, proposes a five-stage cycle of scoping, discovery, prioritisation, validation and mobilisation [3], [4]. This paper makes three contributions. First, it reviews CTEM critically against prior work on vulnerability scoring, exploit prediction, attack graphs and security testing. Second, it tests the operating assumptions of each stage against secondary evidence from two Effycace datasets on confirmed exploitation [5], [6]. Third, following a design-science approach [7], it proposes an operating model: an exposure decision record, a lane-based prioritisation scheme, an outcome metric set, a five-level maturity model and a crosswalk to NIST CSF 2.0, CIS Controls v8.1, ISO/IEC 27001:2022 and the MAS Technology Risk Management Guidelines.
We argue that CTEM’s value lies less in its stages, most of which repackage established practice, than in changing the unit of management from the finding to the validated, owned exposure attached to a business scope. The evidence supports two design consequences: prioritisation needs an event-driven fast lane alongside the ranked cycle, because about half of newly disclosed vulnerabilities that end up exploited are confirmed as exploited within a week [5]; and prioritisation cannot rely on any single score, because neither CVSS nor EPSS alone anticipated most later exploitation [6]. The operating model is proposed, not empirically validated; Section 5 sets out a quasi-experimental design for testing it.
Index Terms—Continuous threat exposure management, exposure management, vulnerability prioritisation, attack path validation, EPSS, KEV, security metrics, cyber risk governance.
Design principles
Manage the validated, owned exposure attached to a business scope, not the scanner finding.
Prioritise in lanes that combine reachability, exploitation evidence and consequence, never a single score.
Run an event-driven fast lane alongside the cycle, because exploitation routinely outpaces a monthly or quarterly rhythm.
Treat validation as the stage that turns a list into evidence, and record its result in the decision record.
Report exposure windows and validation yield, not counts of vulnerabilities closed.
What this means
- Boards and executives
- Ask for the exposure window on critical services and the age of accepted exceptions, not the number of patches applied. Approve scopes in business terms so that security spending can be traced to the services it protects.
- CISOs and risk leaders
- Adopt CTEM as an operating discipline layered on existing vulnerability management, not as a tool purchase. Start with one scope, one decision record and a fast lane, and measure before expanding.
- Security engineering and IT operations
- Combine KEV, EPSS, vendor severity and asset reachability in prioritisation; validate the top of the queue; and agree remediation windows with system owners before an emergency rather than during one.
2Scope and questions
Research questions
- RQ1. What does CTEM add, conceptually and operationally, to established vulnerability management, risk-based prioritisation and security validation?
- RQ2. Which of CTEM’s operating assumptions are supported by public evidence on how vulnerabilities are exploited, and which remain to be tested?
- RQ3. How can an organisation implement CTEM so that its outcomes are measurable, auditable and traceable to the control frameworks it already reports against?
In scope
- CTEM as a management programme for enterprise IT, cloud, SaaS and identity exposures, with a Singapore and Asia-Pacific editorial lens.
- Public standards, peer-reviewed literature and industry reports available on or before 12 November 2026.
- Secondary use of Effycace’s published datasets on CISA KEV, CVSS and EPSS for 2023 to 2026.
Out of scope
- Comparison or endorsement of commercial exposure management, attack surface management or breach and attack simulation products.
- Operational technology and safety-instrumented systems, where validation techniques carry different hazards and need specialist treatment.
- Empirical measurement of CTEM effectiveness in any organisation; Section 5 proposes how that measurement could be done.
3Methodology
The study follows a design-science research approach [7]: it identifies a problem of practice, builds an artefact (here, a CTEM operating model), and evaluates the artefact against explicit criteria. Evaluation in this paper is analytical. Empirical evaluation is designed in Section 5 but not performed.
The knowledge base was assembled through a structured narrative review, not a systematic review. Sources were selected purposively from four groups: (a) normative standards and guidance from NIST, CISA, FIRST, CIS, ISO/IEC and MAS; (b) peer-reviewed research on vulnerability severity, exploit prediction, attack graphs and adversary modelling; (c) industry incident reports with stated samples, limited to the 2026 editions of the Verizon DBIR and Mandiant M-Trends; and (d) Gartner’s descriptions of CTEM. No completeness claim is made.
Gartner’s CTEM research notes are subscription documents and were not accessed directly. The description of CTEM used here relies on Gartner’s public article [4] and on stage names that are consistent across secondary accounts. Claims attributed to Gartner that we could not confirm at source are labelled as reported, and none of the operating model depends on them.
Secondary quantitative evidence comes from two Effycace research reports: an analysis of all 913 KEV entries for vulnerabilities confirmed exploited between January 2023 and November 2026 [5], and a back-test of CVSS and EPSS against 201,099 CVEs and confirmed exploitation in eleven quarterly windows [6]. Their methods, code and data are published with those reports. Figures reused here are copied without re-analysis.
Background and related work
A. Vulnerability management and its limits. Enterprise vulnerability management grew out of patch management, which NIST now frames as preventive maintenance to be planned by asset groups and maintenance plans rather than as a reaction to each advisory [8]. Prioritisation has relied heavily on the Common Vulnerability Scoring System, whose specification states that the base score measures severity and should not be used alone to assess risk [9]. Allodi and Massacci showed, using case-control studies, that a high CVSS score is a weak predictor of exploitation in the wild [10].
B. Exploitation evidence. Two public signals responded to that gap. The Exploit Prediction Scoring System estimates the probability that a vulnerability will be exploited in the next 30 days from observed activity [11], [12]. CISA’s Known Exploited Vulnerabilities catalogue records vulnerabilities with reliable evidence of exploitation [13], and Binding Operational Directive 22-01 requires US federal civilian agencies to remediate them within set deadlines, generally two weeks for vulnerabilities assigned CVEs from 2021 onwards [14]. Stakeholder-Specific Vulnerability Categorization replaces a score with a decision tree over exploitation status, exposure, automatability and mission impact [15].
C. Attack paths and adversary models. A separate line of research asks whether a weakness can actually be reached and chained. Attack graphs model how an adversary can combine vulnerabilities and privileges to reach a goal [16], and logic-based analysers such as MulVAL made graph generation practical at enterprise scale [17]. The intrusion kill chain [18] and MITRE ATT&CK [19] describe adversary behaviour in stages and techniques, which gives validation a vocabulary for what was tested. Technical testing methods themselves are long established [20].
D. CTEM. Gartner introduced CTEM in 2022 as a programme, not a product category, organised as a repeating cycle of scoping, discovery, prioritisation, validation and mobilisation [3], [4]. It was named a top strategic technology trend for 2024, accompanied by a widely reported forecast that organisations prioritising security investment through a CTEM programme would suffer two-thirds fewer breaches by 2026 [21]. That forecast is a planning assumption, not a measured result; at the research cut-off we found no peer-reviewed or methodologically transparent public study that tested it.
E. Governance. NIST CSF 2.0 places vulnerability identification and risk-response prioritisation in its Identify function and continuous improvement from tests and exercises in the same function [22]. NIST IR 8286 describes how cybersecurity risk registers roll up into enterprise risk management [23]. CIS Controls v8.1 [24], ISO/IEC 27001:2022 [25] and, for Singapore financial institutions, the MAS Technology Risk Management Guidelines [26] set comparable expectations. Table I contrasts the three generations of practice this literature describes.
| Dimension | Traditional vulnerability management | Risk-based vulnerability management | CTEM as proposed here |
|---|---|---|---|
| Unit of analysis | Scanner finding (CVE on host) | Finding enriched with threat data | Validated exposure tied to a business scope |
| Scope | Assets the scanner can see | Scanned assets, weighted by criticality | Business-defined scope, including identity, SaaS and third-party paths |
| Main signal | CVSS base score | CVSS plus EPSS, KEV, asset value | Reachability, exploitation evidence and consequence |
| Validation | Rare; annual penetration test | Occasional | Built into each cycle for the top of the queue |
| Output | Ticket per finding | Ranked ticket queue | Exposure decision record with owner and residual risk |
| Success measure | Findings closed; SLA compliance | Risk score reduced | Exposure window and validated exposure reduced |
Source: authors’ synthesis of [8], [9], [11], [15], [3]. Categories are ideal types; real programmes mix them.
Evaluation criteria
The proposed operating model is assessed against five criteria derived from the research questions and from the evaluation guidance of design science [7]. Table VIII in Section 4 reports the assessment.
| Criterion | Question asked of the artefact | Derived from |
|---|---|---|
| C1 Evidence fit | Is each design choice consistent with public evidence on how exploitation happens? | RQ2 |
| C2 Measurability | Can each stage produce a metric whose change indicates reduced exposure? | RQ3 |
| C3 Auditability | Can a third party reconstruct why an exposure was fixed, deferred or accepted? | RQ3 |
| C4 Framework traceability | Does each stage map to recognised control objectives? | RQ3 |
| C5 Proportionality | Can a mid-sized organisation run one cycle without new tooling? | RQ1 |
Source: authors’ criteria, after the design-evaluation guidance in Hevner et al. [7].
Sources
| Source | How it was used | Reliability |
|---|---|---|
| Gartner descriptions of CTEM [3], [4], [21] | Definition of the five-stage cycle and the claims made for it. | Analyst framework. Primary notes behind a paywall; public article used. Forecasts are not evidence. |
| NIST, CISA, FIRST, CIS, ISO/IEC and MAS publications [8], [9], [14], [15], [22], [23], [24], [25], [26] | Normative baseline for vulnerability management, scoring, governance and control mapping. | Authoritative primary sources. Applicability depends on jurisdiction and sector. |
| Peer-reviewed research [10], [11], [16], [17], [18], [7] | Theory and evidence on severity scoring, exploit prediction, attack paths and research method. | Peer-reviewed. Some results pre-date current threat conditions. |
| Verizon DBIR 2026 and Mandiant M-Trends 2026 [1], [2] | Prevalence of exploitation as an initial access vector. | Large but non-random samples of investigated incidents. Indicative of trends, not population rates. |
| Effycace EFF-RR-2026-001 and EFF-RR-2026-002 [5], [6] | Speed of exploitation and the performance of CVSS and EPSS as prioritisation signals. | Reproducible analyses of public data with published code. Outcome limited to CISA-confirmed exploitation. |
Review
Prepared with AI-assisted research and drafting. Reference details, internal data reuse, citation numbering and build behaviour were checked during preparation. No independent subject-matter peer review has been conducted.
- Preparation checks: Automated and AI-assisted checks, Source-link, citation-numbering, content-structure and build verification; not independent peer review
Data availability
4Proposed framework
Framework component 1
Make the validated exposure, not the finding, the unit of management
Proposed · requires local validation
A finding states that a weakness exists on an asset. An exposure states that an adversary could use it to cause a consequence that matters. The difference explains why organisations can close thousands of findings without reducing risk. We define an exposure as a tuple:
where a is an asset or identity; w a weakness, which may be a CVE, a misconfiguration, an excessive privilege, an exposed secret or a process gap; π the path by which an adversary can reach w from a position it can occupy; τ the threat evidence that the weakness class is exploited; and c the consequence for a scoped business service. A finding supplies only a and w. CTEM’s later stages exist to establish the other three, and an exposure becomes actionable only when π and c are known.
The definition deliberately includes weaknesses that have no CVE. Incident data show why. In Mandiant’s 2026 investigations, exploits led initial infection vectors at 32%, but voice phishing (11%) and prior compromise (10%) followed [2]; neither appears in a vulnerability scan, yet both are exposures of identity and process that a scoped programme can discover and reduce. Fig. 1 shows the leading vectors.
Base: Mandiant incident response investigations where the initial vector was identified. Only the four vectors stated in the source are shown; the remainder is not plotted. Source: Mandiant, M-Trends 2026 [2]. The figures describe investigated intrusions, not all organisations.
Verizon’s 2026 report, based on incidents between November 2024 and October 2025, likewise places vulnerability exploitation first at 31% of breaches [1]. Both sources describe non-random samples, so they establish the importance of exploitation, not its rate in any one population.
Framework component 2
Run the five stages as one cycle around one decision record
Proposed · requires local validation
Gartner’s five stages fall naturally into two phases. Scoping, discovery and prioritisation diagnose exposure; validation and mobilisation act on it. Many programmes already perform each stage somewhere: asset inventory in IT, scanning in security, penetration testing through a supplier, remediation in operations. What they lack is a shared record that carries an exposure from one stage to the next. Without it, the evidence produced in validation never reaches the person deciding whether to accept the risk.
We therefore propose a single exposure decision record (EDR) at the centre of the cycle (Fig. 2). Each stage reads from and writes to it. The EDR is deliberately small: it should let an accountable owner understand the decision without opening the scanner, the test report or the ticket. Table III lists its fields; a CSV template is provided with this paper.
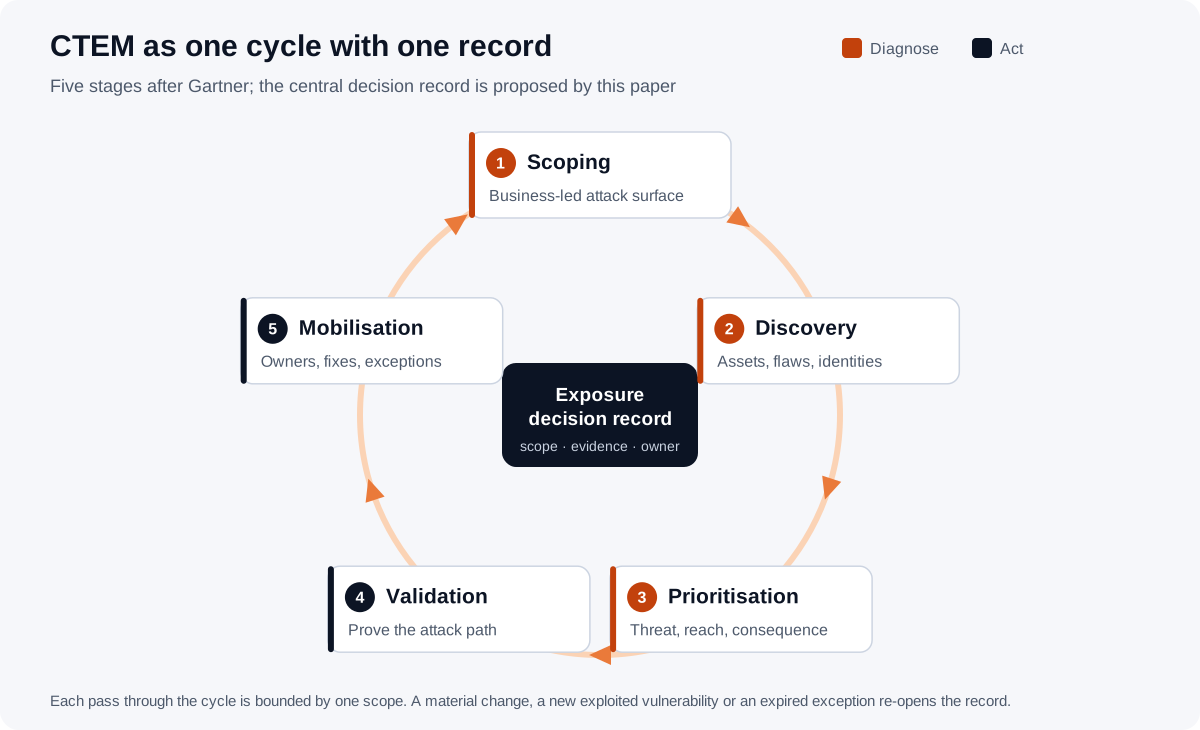
Stage names after Gartner [3], [4]. The central decision record is proposed by this paper. Conceptual model, not observed data.
| Field | Content | Written in stage |
|---|---|---|
| Scope | Business service and adversary position the cycle covers | Scoping |
| Exposure | Asset, weakness, path, threat evidence and consequence, as in (1) | Discovery, prioritisation |
| Lane and target date | Emergency, Priority, Scheduled or Monitor, with the date it is due | Prioritisation |
| Validation result | Confirmed, blocked by a control, not reachable or inconclusive, with method and date | Validation |
| Treatment | Fix, mitigate, redesign or accept; who approved it | Mobilisation |
| Owner | Named person accountable for treatment and for residual risk | Mobilisation |
| Residual risk and expiry | What remains, why it is acceptable and when the decision lapses | Mobilisation |
| Re-open triggers | Events that invalidate the decision, such as a KEV listing or an architecture change | All stages |
Source: proposed by this paper. Template: exposure-decision-record.csv.
Framework component 3
Scope by business service and adversary position
Proposed · requires local validation
Scoping is the stage most often skipped, because scanners make it feel unnecessary: the scope becomes whatever the tool can reach. CTEM inverts this. A scope is a business statement, such as “customer payment initiation and the identities that administer it”, combined with the adversary positions that matter: the internet, a compromised supplier, a phished employee, or an insider with standard access. This mirrors the framing of risk assessment in NIST SP 800-30, which starts from the organisation’s mission and threat sources before vulnerabilities [27], and CSF 2.0’s requirement that critical services and dependencies be understood [22].
Three properties make a scope workable. It is bounded, small enough to complete one cycle within a quarter. It is owned, with a business owner who can accept residual risk. And it is testable, meaning validation can be performed safely within it. The external attack surface and the identity plane of a critical SaaS service are practical first scopes because both are reachable by any adversary and both are commonly under-inventoried.
Framework component 4
Discover beyond the CVE feed, and do not trust enrichment blindly
Proposed · requires local validation
Discovery has two parts: finding the assets in scope and finding their weaknesses. Asset discovery should reconcile at least the configuration management database, cloud provider inventories, identity provider records, certificate transparency and external scanning, because each misses something the others see. CIS Controls 1 and 2 and CSF ID.AM set the baseline [24], [22].
Weakness discovery should cover the classes in (1), not only CVEs: misconfigurations, excessive or dormant privileges, exposed credentials and keys, and unsupported software. For CVEs, a recent change matters. Programmes have long relied on the US National Vulnerability Database to add CVSS scores and product data to each CVE. Effycace’s analysis found that NVD itself scored 83.8% of CVEs with 2023 identifiers but only 15.3% of those with 2026 identifiers (Fig. 3), and that 44.0% of exploited vulnerabilities in its data had no NVD score at all [6]. Tools that read only NVD scores will silently under-rank new vulnerabilities. Discovery must take severity from the CVE Numbering Authority, usually the vendor, and from vendor advisories.
Base: 201,099 non-rejected CVEs (30,669 for 2023; 38,502 for 2024; 43,708 for 2025; 88,220 for 2026). Source: EFF-RR-2026-002 [6], from NVD CVE 2.0 feeds retrieved 11 November 2026.
Framework component 5
Prioritise with reachability, exploitation evidence and consequence, in lanes
Proposed · requires local validation
The central empirical question for CTEM is whether any prioritisation signal can tell defenders in advance which exposures will be used. The evidence says that each signal helps and none suffices. In Effycace’s back-test across eleven quarterly windows, fixing the 10% of the backlog rated CVSS Critical would have caught 43.6% of later-exploited vulnerabilities; the same number chosen by highest EPSS would have caught 38.5% (Fig. 4). Combining the two, “Critical, or EPSS of 10% or more”, flagged 11.1% of the backlog and caught 53.1% [6]. This replicates, with current data, the earlier finding that severity alone is a weak proxy for exploitation [10], and it qualifies the common view that EPSS simply replaces CVSS [11].
Base: 179 vulnerabilities added to CISA KEV in eleven quarterly windows from 10 February 2024 to 10 November 2026, out of 884,547 backlog entries summed across windows. Source: EFF-RR-2026-002 [6], using NVD, CISA KEV v2026.11.10 and FIRST EPSS daily files.
Two further points shape the design. First, scores describe vulnerabilities in general, not their position in a particular environment; 11.7% of later-exploited vulnerabilities in the same data were rated only Medium or Low with EPSS below 1% [6], so reachability and consequence must carry weight of their own. Second, a single ranked list encourages teams to work from the top until capacity runs out, which hides the decision about what is left. Decision trees such as SSVC address the second problem by producing categories rather than ranks [15].
We propose a lane model that combines these lessons (Fig. 5). An exposure enters the matrix only if a path from an adversary-accessible position exists; unreachable items are recorded and monitored. Its lane is then set by exploitation evidence and consequence for the scoped service, and validation may move it one lane:
Here v = +1 when validation confirms the path, −1 when a compensating control is shown to block it, and 0 when validation is inconclusive or not performed. The target windows are proposals to be calibrated against each organisation’s change capacity; the Emergency window is set inside the two-week KEV deadline of BOD 22-01 [14] because of the exploitation speeds discussed next.
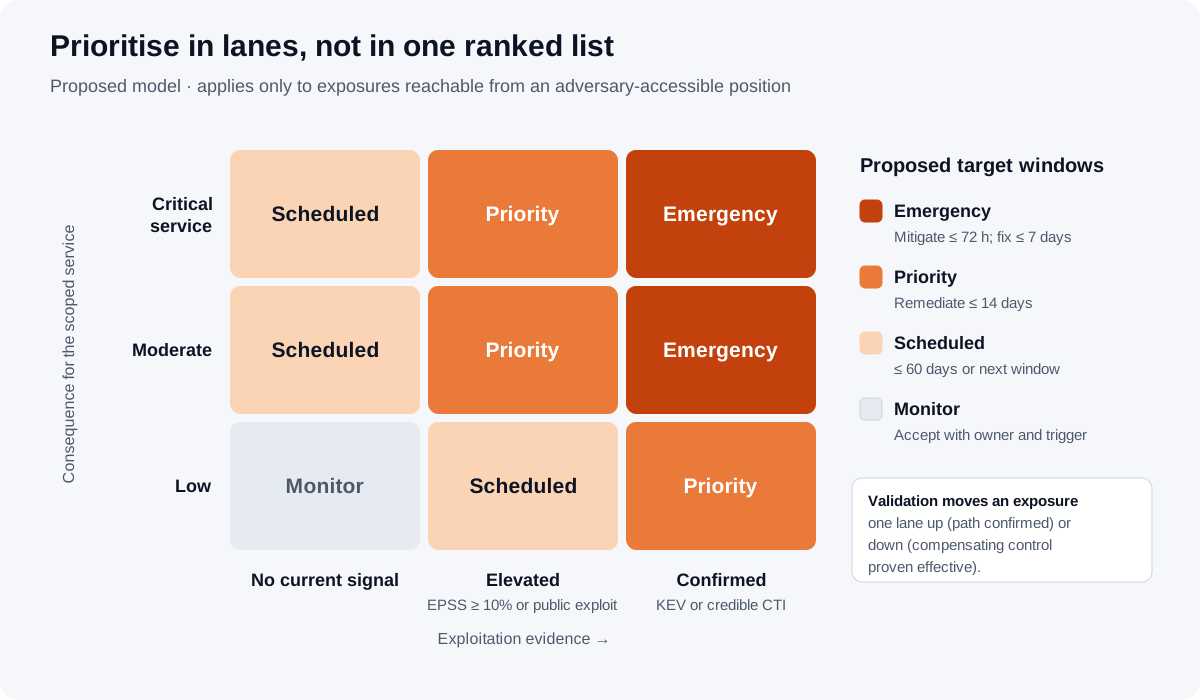
Proposed model. Thresholds follow the signals tested in EFF-RR-2026-002 [6]; target windows are proposals, not benchmarks.
Framework component 6
Run an event-driven fast lane alongside the cycle
Proposed · requires local validation
CTEM is described as a cycle, and cycles have a cadence. Exploitation does not. Of 739 newly disclosed vulnerabilities later added to KEV, 52.5% were confirmed as exploited within a week of publication and 26.1% on or before the day they were published [5]. Across quarterly windows, 69.2% of the vulnerabilities confirmed as exploited were published during that same quarter, so they could not have been on any backlog ranked at its start [6]. Fig. 6 shows how old each vulnerability was when it was listed.
Base: 913 KEV additions (counts 193, 195, 113, 214, 75 and 123), age measured from NVD publication. KEV listing date is a conservative proxy for first exploitation, which often occurs earlier. Source: EFF-RR-2026-001 [5], from CISA KEV [13] and NVD.
The distribution is bimodal. About 43% of additions arrive within a week of publication, which no monthly cycle can absorb, while about 22% concern vulnerabilities more than a year old, which a well-run cycle should already have treated. The design consequence is that CTEM needs two mechanisms: the scoped cycle for the accumulated backlog, and a fast lane triggered by events. We propose four triggers: a KEV listing or credible intelligence of exploitation for a product present in any scope; a vendor out-of-band advisory for an internet-facing product; a public exploit for a Critical vulnerability on a reachable asset; and discovery of exposed credentials or keys. A fast-lane item opens an EDR immediately, starts in the Emergency lane, and is validated in parallel with mitigation rather than before it.
Framework component 7
Validate the path, not just the presence of the weakness
Proposed · requires local validation
Validation is the stage that distinguishes CTEM from risk-based vulnerability management. Its purpose is to replace an inference (“this is probably exploitable here”) with evidence (“we reached the payment database from the internet using this path”, or “the web application firewall blocked every variant we tried”). Validation answers three questions: whether the attack would work, whether detection and response would notice it, and whether the proposed fix closes the path. Table IV compares the available techniques.
| Technique | Main question answered | Evidence strength | Relative cost | Basis |
|---|---|---|---|---|
| Configuration and control check | Is a compensating control present and correctly configured? | Low to moderate | Low | [20] |
| Attack path analysis | Can the weakness be reached and chained to the scoped asset? | Moderate (model-based) | Low to medium | [16], [17] |
| Breach and attack simulation | Do controls block or detect specific ATT&CK techniques? | Moderate | Medium | [19] |
| Penetration test | Can a skilled tester exploit the path in practice? | High for tested paths | Medium to high | [20], [24] |
| Red team or adversarial simulation | Would a goal-directed adversary succeed undetected? | High, narrow | High | [26] |
Source: authors’ synthesis of the cited works. Evidence strength refers to the question in column 2 only.
Two rules keep validation proportionate. First, validate the top of the queue, not all of it: every Emergency and Priority exposure on a critical service, and a sample of the rest to estimate how well prioritisation is working. Second, record the result in a fixed vocabulary (confirmed, blocked by control, not reachable, inconclusive) with the method and date, because the ratio of confirmed to attempted validations is itself a measure of prioritisation precision (Section 4, component 9). Validation in production must be authorised, scoped and run under agreed rules of engagement; for regulated financial institutions in Singapore, the MAS guidelines set expectations for vulnerability assessment, penetration testing and adversarial attack simulation exercises [26].
Framework component 8
Mobilise owners with decision rights and expiring exceptions
Proposed · requires local validation
Most exposure is closed by people outside the security team: system owners, platform engineers, application developers and suppliers. Mobilisation is the organisational work of getting validated exposures treated. It is the last stage of the cycle and, in practice, the one where programmes most often stall. Three mechanisms matter.
- Pre-agreed decision rights. Target windows by lane, and who may approve an exception at each level, are agreed with system owners in advance and approved by the risk committee. During an emergency the discussion is then about execution, not authority.
- A wider set of treatments. Patching is one option among several. Configuration change, compensating controls, segmentation, retiring the asset or redesigning the service are often faster or more durable, and validation can show that they work.
- Expiring exceptions. Every accepted exposure has an owner, a rationale, an expiry date and re-open triggers in the EDR. Accepted exposures roll up into the cybersecurity risk register and then into enterprise risk reporting, as NIST IR 8286 describes [23], satisfying CSF 2.0 ID.RA-06 on tracked risk responses [22].
Framework component 9
Measure exposure reduction, not activity
Proposed · requires local validation
Conventional programme metrics, such as findings closed or percentage of patches applied within SLA, measure effort. They can improve while exposure grows, and once they become targets they invite gaming, in the sense of Strathern’s formulation of Goodhart’s law that a measure which becomes a target ceases to be a good measure [28]. CTEM needs outcome metrics tied to scopes. The central one is the exposure window:
where tevidence is the earliest time the organisation had evidence that exposure i was exploitable in its environment (a KEV listing, a validated path or a fast-lane trigger) and ttreated is when a fix or effective mitigation was verified. Report the median and 90th percentile per scope and lane, because means are distorted by long-lived exceptions. Table V sets out the proposed metric set; a CSV of definitions accompanies this paper.
| Metric | Definition | What a change indicates | Caution |
|---|---|---|---|
| Exposure window | Median and P90 of Wi, by scope and lane | Speed of risk reduction where it matters | Depends on honest recording of tevidence |
| Fast-lane adherence | Share of fast-lane items mitigated within the Emergency window | Readiness for exploitation at speed | Small numbers; report counts with percentages |
| Validated exposure count | Open exposures with a confirmed path, per scope | Residual exploitable risk | Falls if validation stops; read with validation volume |
| Validation yield | Confirmed ÷ attempted validations | Precision of prioritisation | Very high yield may mean too little is tested |
| Scope coverage | Assets discovered and assessed ÷ assets in scope | Completeness of discovery | Denominator is itself uncertain |
| Recurrence rate | Exposures re-opened within 180 days of treatment | Durability of fixes; root-cause quality | Needs stable exposure identifiers |
| Exception age | Median age of accepted exposures; share past expiry | Governance discipline | Low age may reflect rubber-stamp renewals |
Source: proposed by this paper. Definitions file: metric-definitions.csv.
Framework component 10
Assess maturity by the evidence a programme can produce
Proposed · requires local validation
Maturity models for security are often scored by whether practices exist. For CTEM that is the wrong test, because each practice can exist without reducing exposure. The model in Fig. 7 defines each level by the evidence a programme can produce: at Level 2, a record of which KEV items were in scope and how quickly they were treated; at Level 3, decision records per scope; at Level 4, validation results that changed lanes and treatments; at Level 5, metric trends that changed scope, investment or architecture.
Most organisations implementing CTEM begin between Levels 1 and 2. The practical goal for a first year is Level 3 for one or two critical scopes, with a fast lane operating across the whole estate. Level 4 requires validation capability, internal or contracted, and Level 5 requires at least several cycles of metric history.
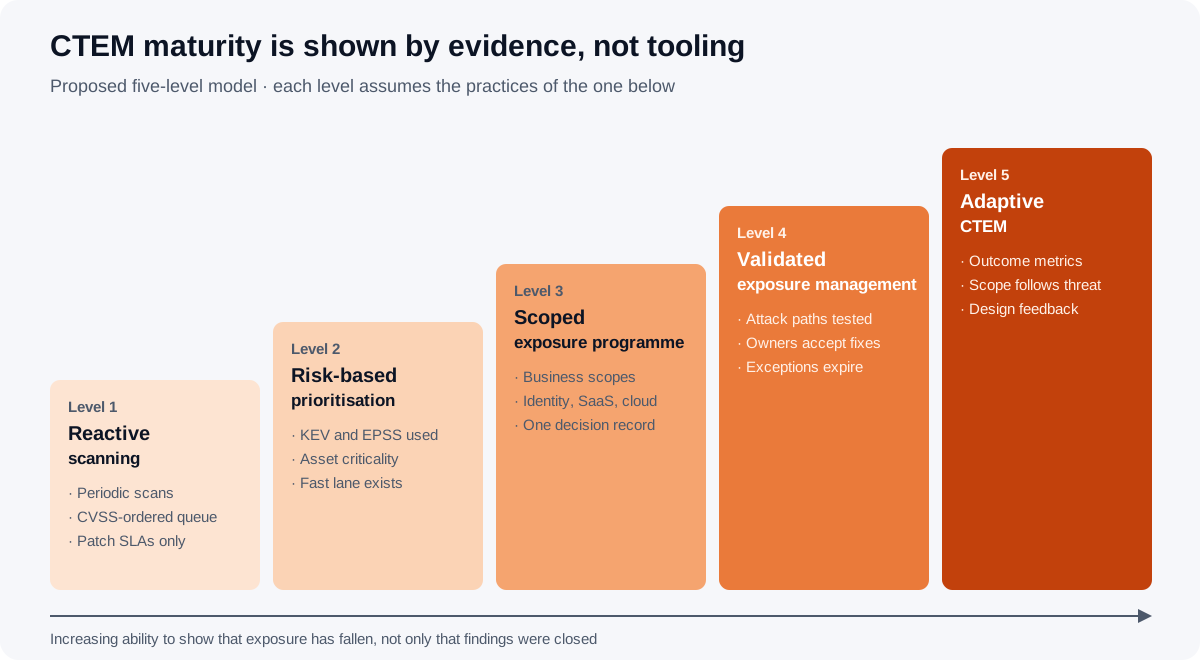
Proposed model. It is not a benchmark and has not been calibrated against a population of organisations.
Framework component 11
Map each stage to the control frameworks already in use
Proposed · requires local validation
CTEM is not a compliance framework, and adopting it should not create a parallel reporting line. Table VI maps each stage to control objectives most organisations already report against, so that CTEM evidence can satisfy existing assurance requirements.
| CTEM stage | NIST CSF 2.0 [22] | CIS Controls v8.1 [24] | ISO/IEC 27001:2022 Annex A [25] | MAS TRM 2021 [26] |
|---|---|---|---|---|
| Scoping | GV.OC-04; ID.AM-05 | 1.1 (context for scope) | 5.9 | Governance and risk assessment expectations |
| Discovery | ID.AM-01, ID.AM-02; ID.RA-01 | 1.1, 2.1; 7.5, 7.6 | 5.9; 8.8; 8.9 | §13 vulnerability assessment |
| Prioritisation | ID.RA-02, ID.RA-04, ID.RA-05 | 7.1, 7.2 | 5.7; 8.8 | §12 threat intelligence in cyber operations |
| Validation | ID.IM-02 | 18.1, 18.2 | 8.8; 5.35 | §13 penetration testing and adversarial attack simulation |
| Mobilisation | ID.RA-06; PR.PS-02 | 7.2, 7.7 | 8.8; 8.32 | Patch, change and risk acceptance expectations |
Source: authors’ mapping to the cited documents as at 12 November 2026. A mapping indicates where CTEM evidence can support a control objective; it is not a compliance determination.
Framework component 12
Worked example: one cycle for one scope
Proposed · requires local validation
A hypothetical Singapore logistics company runs a customer portal used by shippers to book cargo and view invoices. Its first CTEM scope is “the customer portal, its single sign-on, and the remote-access path used by its two hosting suppliers”, owned by the head of digital channels, with the internet and a compromised supplier account as adversary positions. Table VII traces the cycle. All values are hypothetical and are chosen only to show how the stages narrow the work and change its nature.
| Stage | What happened | Result written to the decision record |
|---|---|---|
| Scoping | Business owner and CISO agree scope, adversary positions and target windows | Scope statement; owner named |
| Discovery | Inventories reconciled; 14 unrecorded assets found, including a staging site; 2,400 scanner findings and 37 identity or configuration weaknesses | Asset list; weakness list with CNA severity |
| Prioritisation | 310 findings on reachable assets; 18 enter Priority or Emergency lanes, including a VPN appliance flaw listed in KEV and legacy authentication still enabled on single sign-on | Lane and due date per exposure |
| Validation | Supplier-account path to the invoice database confirmed; staging site not reachable from the internet after all; a WAF rule shown to block one Priority exposure | Two exposures promoted, one demoted, one closed as not reachable |
| Mobilisation | VPN patched in 3 days; legacy authentication disabled; supplier access moved behind conditional access; one exposure accepted for 60 days pending a platform upgrade | Treatments verified; one exception with expiry and trigger |
Hypothetical scenario for explanation only. No organisation, assessment or measured result is described.
The point of the example is the change in output. A conventional programme would report 2,400 findings and an SLA percentage. The CTEM cycle reports that one confirmed path to customer data was closed in three days, that an unknown asset was found and assessed, and that one exposure is accepted, by whom and until when.
Framework component 13
Evaluate CTEM itself, and treat its claims as hypotheses
Proposed · requires local validation
Answering RQ1, CTEM adds little that is technically new. Asset discovery, scanning, threat-informed prioritisation, penetration testing and remediation governance all pre-date it [8], [15], [16], [20]. Its contribution is integrative: it binds those practices into one cycle, insists that scope be set in business terms, and makes validation a routine stage rather than an annual event. That contribution is real, but it is organisational, and its value therefore depends on execution more than on tooling.
Four weaknesses deserve attention. Definitional drift: because CTEM is defined by an analyst firm and implemented largely through vendor products, its meaning has widened to cover almost any exposure-related product; organisations should define it by the outputs in Table III, not by product features. Unverified claims: the forecast of a two-thirds reduction in breaches by 2026 [21] has, to our knowledge, not been tested in any transparent study, and should not be used to justify investment. Validation cost and risk: validation in production can disrupt services, and its coverage will always be partial. Data dependence: the decline in NVD enrichment (Fig. 3) shows that CTEM rests on a vulnerability-data supply chain that organisations do not control.
Table VIII answers RQ3 by assessing the proposed operating model against the criteria set out in Section 3.
| Criterion | Assessment | Residual concern |
|---|---|---|
| C1 Evidence fit | Lanes and the fast lane follow the exploitation speeds and score performance in [5], [6] | Evidence is limited to CISA-confirmed exploitation of CVEs |
| C2 Measurability | Each stage writes fields from which Table V metrics can be computed | Metric baselines do not yet exist |
| C3 Auditability | The EDR records decision, evidence, owner and expiry | Quality depends on disciplined record-keeping |
| C4 Framework traceability | Every stage maps to CSF 2.0, CIS, ISO/IEC 27001 and MAS TRM (Table VI) | Mappings are interpretive |
| C5 Proportionality | One scope can run on existing scanners, inventories and a contracted test | Validation capacity limits Level 4 |
Source: authors’ analytical evaluation against the criteria in Table II. Not an empirical validation.
5Implementation and validation
Recommendations are ordered by priority. Effort is a broad estimate for a mid-sized organisation; your own will depend on what is already in place.
| # | Recommendation | Owner | Priority | Effort | Framework reference |
|---|---|---|---|---|---|
| 1 | Define one CTEM scope in business terms, with an accountable owner, adversary positions and agreed target windows. | CISO with business service owner | High | Low | NIST CSF 2.0 GV.OC-04, ID.AM-05 |
| 2 | Stand up an event-driven fast lane triggered by KEV listings, out-of-band vendor advisories, public exploits for reachable Critical vulnerabilities and exposed secrets. | Security operations | High | Medium | CISA BOD 22-01 NIST CSF 2.0 ID.RA-08 |
| 3 | Take CVSS scores from the CNA or vendor where NVD has not scored a CVE, and add EPSS and KEV to prioritisation. | Vulnerability management lead | High | Low | CIS Controls v8.1 7.2 NIST CSF 2.0 ID.RA-01 |
| 4 | Adopt the exposure decision record and the lane model for the first scope; reconcile them with the existing ticketing system. | Vulnerability management lead | High | Medium | NIST CSF 2.0 ID.RA-05, ID.RA-06 |
| 5 | Validate every Emergency and Priority exposure on a critical service, and a sample of the rest, recording results in a fixed vocabulary. | Offensive security or contracted tester | Medium | Medium | CIS Controls v8.1 18.1 MAS TRM §13 |
| 6 | Replace activity metrics in board reporting with exposure window, fast-lane adherence and exception age per critical scope. | CISO and risk committee | Medium | Low | NIST IR 8286 NIST CSF 2.0 ID.IM-02 |
A first-year sequence
Days 0–30. Choose the first scope; agree owner, adversary positions and lane windows with the risk committee; reconcile asset sources; turn on KEV and vendor-advisory triggers for the fast lane across the whole estate.
Days 31–90. Run the first full cycle for the scope. Open an EDR for every Emergency and Priority exposure. Commission validation of the top of the queue. Record baseline values for the metrics in Table V.
Months 4–12. Complete three further cycles, add one or two scopes, and review lane thresholds against observed validation yield. Report exposure window and exception age to the board each quarter.
Empirical validation design
The operating model in this paper is a set of hypotheses. We propose to test it with a stepped-wedge design, in which participating organisations, or scopes within a large organisation, adopt the model in a randomised order over successive quarters. Each unit serves as its own control before adoption, and later adopters serve as concurrent controls for earlier ones, which separates the effect of the model from general improvements over time.
Primary outcomes would be the median and 90th-percentile exposure window for KEV-listed vulnerabilities on in-scope assets and the count of validated exposures per scope. Secondary outcomes would include incidents whose initial access used a weakness that was known and in scope. Effects should be estimated with mixed models that allow for differences between organisations, and reported with confidence intervals and the number of units. A minimum of eight to twelve scopes across at least three organisations would be needed for estimates to be informative. Effycace invites organisations interested in participating to contact the author.
6Limitations
- This is a conceptual and analytical study. The operating model, lane thresholds, target windows, metrics and maturity levels are proposed and have not been empirically validated or calibrated in any organisation.
- Gartner’s CTEM research notes are subscription documents and were not accessed directly; Gartner’s public article could be consulted only in archived form. Claims attributed to Gartner, including the 2026 breach-reduction forecast, are reported as described in public sources and are not relied on by the operating model.
- Quantitative evidence reused from EFF-RR-2026-001 and EFF-RR-2026-002 uses CISA KEV listing as the outcome. KEV records exploitation that CISA has confirmed, which is a subset of all exploitation and is biased towards products relevant to US federal agencies. It does not cover misconfigurations, identity weaknesses or other exposures without CVEs.
- Verizon and Mandiant figures come from non-random samples of investigated incidents and describe those samples, not population rates. Fig. 1 shows only the vectors the source reports.
- The framework crosswalk is interpretive and reflects documents as at 12 November 2026. It is not a compliance or legal determination.
- The review is a structured narrative review, not a systematic review, and may omit relevant work. No independent peer review has been conducted.
7How to use this whitepaper
This is a whitepaper, so its components are proposed practices, not measured findings. Statements of fact carry citations in IEEE style; numbered references are listed in Section 8. Figures that show data state their base and source. Diagrams and the worked example are conceptual or hypothetical. Confidence labels below describe the strength of support for a judgement, not a probability.
- High confidence
- Based on good-quality information from several independent sources, or on a complete dataset. A high-confidence judgement can still be wrong.
- Moderate confidence
- Based on credible information, but with gaps, a limited sample or more than one plausible interpretation.
- Low confidence
- Based on scarce, fragmented or single-source information. Treat it as something to watch, not as the sole basis for a major decision.
8References
References follow IEEE style and are numbered in order of first citation. Bracketed numbers in the text link to the matching entry.
- Verizon Business, “2026 Data Breach Investigations Report,” Verizon, Basking Ridge, NJ, USA, 2026. Accessed: Nov. 12, 2026. [Online]. Available: https://www.verizon.com/business/resources/reports/dbir/
- Mandiant, “M-Trends 2026,” Google Cloud, Mar. 24, 2026. Accessed: Nov. 12, 2026. [Online]. Available: https://cloud.google.com/blog/topics/threat-intelligence/m-trends-2026
- J. D’Hoinne, P. Shoard, and M. Schneider, “Implement a continuous threat exposure management (CTEM) program,” Gartner, Inc., Stamford, CT, USA, Research Note, Jul. 2022. (Subscription document; not accessed directly.)
- K. Panetta, “How to manage cybersecurity threats, not episodes,” Gartner, Inc., Aug. 2023. Archived Jan. 9, 2025. [Online]. Available: https://web.archive.org/web/20250109044003/https://www.gartner.com/en/articles/how-to-manage-cybersecurity-threats-not-episodes
- Effycace Research Team, “Exploited at the edge: What four years of confirmed attacks say about patching priorities,” Effycace Solutions Pte Ltd, Singapore, Research Report EFF-RR-2026-001, v1.0, Nov. 2026. [Online]. Available: /research/reports/exploited-vulnerabilities-2023-2026/
- Effycace Research Team, “Severity is not a schedule: How well CVSS and EPSS predicted real exploitation,” Effycace Solutions Pte Ltd, Singapore, Research Report EFF-RR-2026-002, v1.0, Nov. 2026. [Online]. Available: /research/reports/cvss-epss-exploitation-2024-2026/
- A. R. Hevner, S. T. March, J. Park, and S. Ram, “Design science in information systems research,” MIS Quarterly, vol. 28, no. 1, pp. 75–105, Mar. 2004, doi: 10.2307/25148625.
- M. Souppaya and K. Scarfone, “Guide to enterprise patch management planning: Preventive maintenance for technology,” Nat. Inst. Standards Technol., Gaithersburg, MD, USA, NIST SP 800-40 Rev. 4, Apr. 2022, doi: 10.6028/NIST.SP.800-40r4. [Online]. Available: https://doi.org/10.6028/NIST.SP.800-40r4
- Forum of Incident Response and Security Teams, “Common Vulnerability Scoring System version 4.0: Specification document,” FIRST, Nov. 2023. [Online]. Available: https://www.first.org/cvss/v4.0/specification-document
- L. Allodi and F. Massacci, “Comparing vulnerability severity and exploits using case-control studies,” ACM Trans. Inf. Syst. Secur., vol. 17, no. 1, Art. no. 1, pp. 1–20, Aug. 2014, doi: 10.1145/2630069.
- J. Jacobs, S. Romanosky, B. Edwards, I. Adjerid, and M. Roytman, “Exploit prediction scoring system (EPSS),” Digit. Threats: Res. Pract., vol. 2, no. 3, Art. no. 20, pp. 1–17, Jul. 2021, doi: 10.1145/3436242.
- Forum of Incident Response and Security Teams, “Exploit prediction scoring system (EPSS),” FIRST. Accessed: Nov. 11, 2026. [Online]. Available: https://www.first.org/epss/
- Cybersecurity and Infrastructure Security Agency, “Known exploited vulnerabilities catalog,” CISA. Accessed: Nov. 11, 2026. [Online]. Available: https://www.cisa.gov/known-exploited-vulnerabilities-catalog
- Cybersecurity and Infrastructure Security Agency, “Binding Operational Directive 22-01: Reducing the significant risk of known exploited vulnerabilities,” CISA, Nov. 3, 2021. [Online]. Available: https://www.cisa.gov/news-events/directives/bod-22-01-reducing-significant-risk-known-exploited-vulnerabilities
- Cybersecurity and Infrastructure Security Agency, “Stakeholder-specific vulnerability categorization guide,” CISA, Nov. 2022. [Online]. Available: https://www.cisa.gov/stakeholder-specific-vulnerability-categorization-ssvc
- O. Sheyner, J. Haines, S. Jha, R. Lippmann, and J. M. Wing, “Automated generation and analysis of attack graphs,” in Proc. IEEE Symp. Security and Privacy, Berkeley, CA, USA, 2002, pp. 273–284, doi: 10.1109/SECPRI.2002.1004377.
- X. Ou, S. Govindavajhala, and A. W. Appel, “MulVAL: A logic-based network security analyzer,” in Proc. 14th USENIX Security Symp., Baltimore, MD, USA, 2005, pp. 113–128.
- E. M. Hutchins, M. J. Cloppert, and R. M. Amin, “Intelligence-driven computer network defense informed by analysis of adversary campaigns and intrusion kill chains,” in Proc. 6th Int. Conf. Information Warfare and Security, Washington, DC, USA, 2011, pp. 113–125.
- B. E. Strom, A. Applebaum, D. P. Miller, K. C. Nickels, A. G. Pennington, and C. B. Thomas, “MITRE ATT&CK: Design and philosophy,” The MITRE Corp., McLean, VA, USA, Tech. Rep. MTR180360R1, Mar. 2020. [Online]. Available: https://attack.mitre.org/docs/ATTACK_Design_and_Philosophy_March_2020.pdf
- K. Scarfone, M. Souppaya, A. Cody, and A. Orebaugh, “Technical guide to information security testing and assessment,” Nat. Inst. Standards Technol., Gaithersburg, MD, USA, NIST SP 800-115, Sep. 2008, doi: 10.6028/NIST.SP.800-115. [Online]. Available: https://doi.org/10.6028/NIST.SP.800-115
- J. D’Hoinne and P. Shoard, “Top strategic technology trends for 2024: Continuous threat exposure management,” Gartner, Inc., Stamford, CT, USA, Research Note, Oct. 16, 2023. (Subscription document; not accessed directly.)
- National Institute of Standards and Technology, “The NIST Cybersecurity Framework (CSF) 2.0,” NIST, Gaithersburg, MD, USA, NIST CSWP 29, Feb. 2024, doi: 10.6028/NIST.CSWP.29. [Online]. Available: https://doi.org/10.6028/NIST.CSWP.29
- K. Stine, S. Quinn, G. Witte, and R. K. Gardner, “Integrating cybersecurity and enterprise risk management (ERM),” Nat. Inst. Standards Technol., Gaithersburg, MD, USA, NIST IR 8286, Oct. 2020, doi: 10.6028/NIST.IR.8286. [Online]. Available: https://doi.org/10.6028/NIST.IR.8286
- Center for Internet Security, “CIS Critical Security Controls, version 8.1,” CIS, East Greenbush, NY, USA, Jun. 2024. [Online]. Available: https://www.cisecurity.org/controls/v8-1
- Information Security, Cybersecurity and Privacy Protection — Information Security Management Systems — Requirements, ISO/IEC 27001:2022, International Organization for Standardization, Geneva, Switzerland, Oct. 2022.
- Monetary Authority of Singapore, “Technology risk management guidelines,” MAS, Singapore, Jan. 2021. [Online]. Available: https://www.mas.gov.sg/regulation/guidelines/technology-risk-management-guidelines
- Joint Task Force Transformation Initiative, “Guide for conducting risk assessments,” Nat. Inst. Standards Technol., Gaithersburg, MD, USA, NIST SP 800-30 Rev. 1, Sep. 2012, doi: 10.6028/NIST.SP.800-30r1. [Online]. Available: https://doi.org/10.6028/NIST.SP.800-30r1
- M. Strathern, “‘Improving ratings’: Audit in the British university system,” European Review, vol. 5, no. 3, pp. 305–321, Jul. 1997, doi: 10.1002/(SICI)1234-981X(199707)5:3<305::AID-EURO184>3.0.CO;2-4.
9About this whitepaper
- Author
- Effycace Research Team, Effycace Solutions
- Funding and interests
- Published by Effycace Solutions and written by the Effycace Research Team. Effycace Solutions provides cybersecurity advisory services, including exposure and vulnerability management; readers should weigh the paper with that interest in mind. No vendor sponsored, reviewed or approved this paper. It was prepared with AI-assisted research and drafting from the cited sources. No client information was used.
- Distribution
- TLP:CLEAR This report may be shared freely, with attribution.
- Corrections
- If you find an error, write to contact@effycace.com. Corrections are recorded in the version history below.
How to cite
Effycace Research Team, “Continuous Threat Exposure Management: a critical review and an evidence-led operating model,” Effycace Solutions Pte Ltd, Whitepaper EFF-WP-2026-004, v1.0, Nov. 2026. [Online]. Available: https://www.effycace.com/research/reports/continuous-threat-exposure-management-ctem/
Version history
| Version | Date | Change |
|---|---|---|
| 0.9 | 12 November 2026 | Editorial draft with IEEE references, seven figures, eight tables and supporting templates. Not published. |
| 1.0 | 12 November 2026 | First publication edition, with author attribution, IEEE references and explicit review limitations. |
This report is general information, not advice for your specific circumstances. See our Terms of Use.